
This feature will facilitate the evaluation of the efficiency of a ventilation system
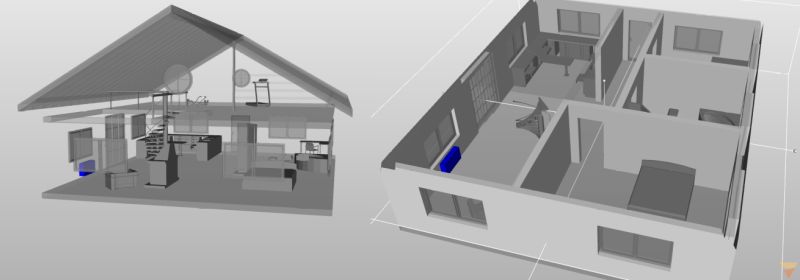
The image below shows the IFC model of a small cottage with a mansard. We placed a ventilator in the living room (blue box). Fresh new air enters the room form the above flowing upwards. The air then re-enters the ventilator from below.
It is difficult to evaluate the efficiency of a ventilation system. Time is the missing information. How much time is needed to renew the air in the apartment ? Are there areas of the house where the stale air is tending to stagnate ?
vento-cfd developed a post-processing visualization feature that responds to these needs.
The 2 videos show the same time transient. The first one makes use of 3 sections showing the color map of the concentration of fresh air which is transported and diffused in the house. Please notice the logarithmic scale of the concentration (in g/m^3)
The second one shows the same transient by using 3 isosurfaces of the fresh air concentration, red, green and blue, respectively for high, medium and low concentration levels.
The time lapse is a few hours.
Contact-us for more information.