The PFD, which stands for Process Flow Diagram, also called a “flowsheet”, is a diagram generally used in chemical and process engineering to show the interconnections between equipment and processes in an industrial plant. Using this diagram it is possible to describe in detail the relationships between the main equipment and the flow of fluids involved in the process. It indicates the relative specifications for each of them (such as temperature, pressure, flow rate, density, etc.).
Very often there is confusion between the PFD and the P&ID, the Piping and Instrumentation Diagram, which means the technical drawing that allows you to represent the complexity of an industrial plant, from which it is also possible to extract the Datasheets (the technical data sheets), the Hook-ups (the typical assembly sheets) and the specifications for the connection of each element of the plant. On the basis of the data reported in this diagram it will be possible to study the path of the pipes (piping) and have a detailed three-dimensional representation from which to extract all the information necessary for the manufacture of piping lines and automation wiring diagrams.
However, the similarity between the acronyms and the technical details present in each diagram can be confusing. Understanding these distinct process schemes, in fact, is not only an academic matter, but has concrete implications in the design, construction and maintenance of industrial plants.
In this article, we discover the main differences between PFD and P&ID and the strategic role these diagrams play in the design of an industrial plant.
What is PDF (Process Flow Diagram)?
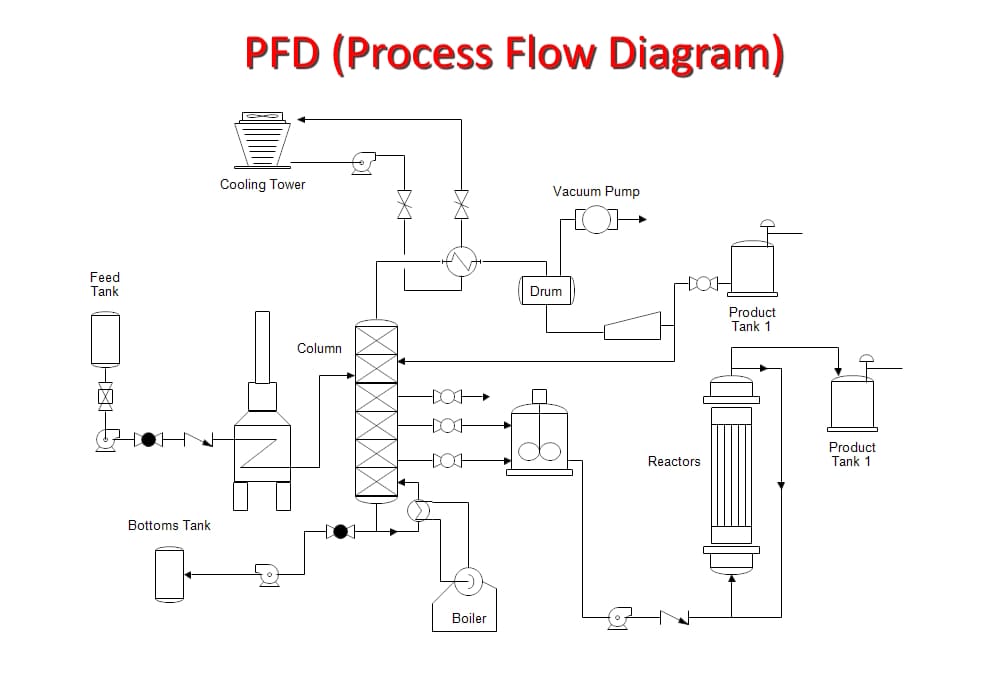
The Process Flow Diagram is a graphic tool of fundamental importance in the initial design phase of an industrial plant. This process diagram, through a simplified representation, illustrates the relationships between the main elements of a project, such as process equipment and fluid flows. Its function is to outline the path and transformation that raw materials undergo within the plant, until they become finished products.
Despite its apparent simplicity, the PFD scheme provides an immediate overview: it allows you to identify the main steps of the process and understand the workflow without dwelling on the technical details. This feature makes it particularly useful in preliminary discussions of a project, where strategic decisions need a clear understanding of the process as a whole, without technical details overloading or diverting attention from the main goal.
The main purpose of the PFD is therefore to provide engineers and designers with a first document with which to visualize the individual operating phases of a process, without including all piping systems and other minor components.
The Difference Between PFD, P&ID, and PID Controller
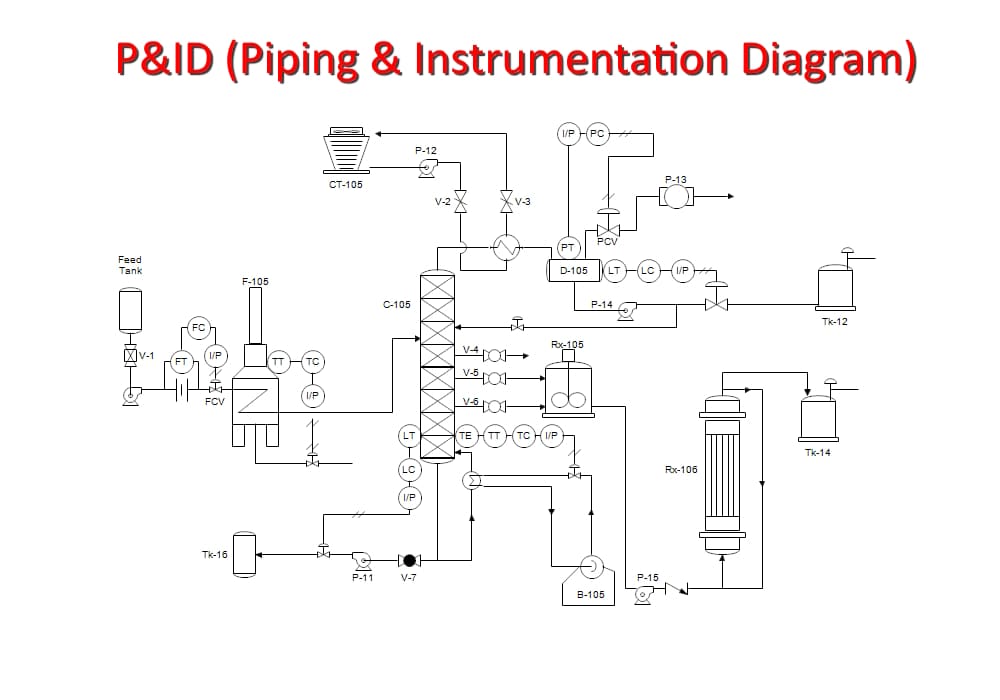
When exploring the facets of plant design, it is essential to understand the differences between a Process Flow Diagram and a Process & Instrumentation Diagram. The PFD is a macro-map that allows you to outline and understand the general flow of an industrial process, highlighting the operating sequences and the relationships between the main equipment. For its part, the P&ID represents the detailed evolution of this flow, including all the technical information necessary for the analysis, design and implementation of each element of the plant.
While the Process Flow Diagram provides a high-level picture that is useful for making strategic decisions, the Piping & Instrumentation Diagram goes into detail about the technical specifications: it shows the valves, piping lines, measurement and control instruments and other details that are critical to the construction, operation and maintenance of the plant.
In other words, the PFD provides an overview of the main existing process steps, while the P&ID analyzes in detail how each individual phase is carried out and controlled, providing more information relating, for example: to the equipment (engines, turbines, etc.), to the pipes, connections, to the framework elements, up to the pumps and vessels used for the storage of fluids.
The design of a plant can also be simplified by using software that speeds up the graphic drafting of process diagrams: an example is ESApro P&ID, the AutoCAD application that includes two distinct modules, one graphic and one dedicated to data management. By using these tools, it is therefore possible to supervise every single phase of diagram development and automate the design of the system: in fact, the application provides designers with multiple functions dedicated to the management of lines and the automatic positioning of components.
The transition between the two diagrams is a crucial step in the engineering process: from a conceptual approach to an executive one, where precision and attention to detail are fundamental to the success of the project.
PID Controller
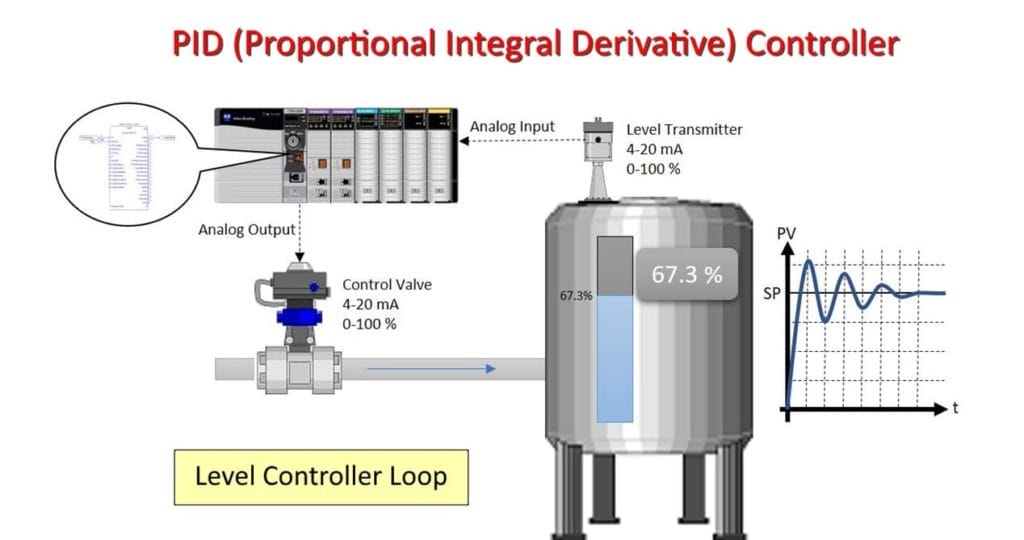
Finally, these two diagrams should not be confused with the PID controller, an acronym for Proportional Integral Derivative, the electronic device used during the control of industrial processes and in many other systems that require continuous control. PID controllers, also known as PID regulators, in fact, are devices that allow you to control one of the phases of the process: they use an algorithm that allows, while the system is running, to correct and self-regulate the variations of the variables being controlled.
Do you want to discover the features of software dedicated to process diagrams?
Do you want to know more? Contact us !
Francesco Pais initially wrote this post on December 15th